
August 2003, Issue No. 208
A monthly report on
environmental and pesticide related issues
A monthly report on environmental and pesticide related issues
In This Issue
Growing
the Dry Bean Market: WSU and Bean/Cowpea CRSP Work to Expand
the Viability of Beans in Africa and at Home
Pesticide Use and
IPM in Washington's Pear and Cherry Orchards
|
|
|
|
|
| Pesticide Use and IPM in Washington's Pear and Cherry Orchards | |
Open Forum: In an attempt to promote free and open discussion of issues, Agrichemical and Environmental News encourages letters and articles with differing views. To discuss submission of an article, please contact Dr. Allan Felsot at (509) 372-7365 or afelsot@tricity.wsu.edu; Dr. Catherine Daniels at (253) 445-4611 or cdaniels@tricity.wsu.edu; Dr. Doug Walsh at (509) 786-2226 or dwalsh@tricity.wsu.edu; Dr. Vincent Hebert at (509) 372-7393 or vhebert@tricity.wsu.edu; or AENews editor Sally O'Neal Coates at (509) 372-7378 or scoates@tricity.wsu.edu. EDITORIAL POLICY, GUIDELINES FOR SUBMISSION.
Go to Agrichemical and Environmental News Index
Go to WSPRS (Washington State Pest Management Resource Service) Home Page
Growing the Dry Bean Market
WSU and Bean/Cowpea CRSP Work to Expand Viability of Beans in Africa and at Home
Dr. Carol A. Miles, Agricultural Systems Specialist, with Madhu Sonde, Research Assistant, WSU
Dry beans (Phaseolus vulgaris) are the most important grain legume in the world for direct human consumption. Varieties of dry beans are widely cultivated in tropical, subtropical and temperate regions. They are a relatively low-cost food and they promote health with their high nutritive value. Indeed, dry beans can be considered a nearly perfect food based on their high protein content and high levels of fiber, complex carbohydrates, and other essential vitamins and minerals. A cup of cooked dry beans contains more calcium and iron than three ounces of cooked meat but contains no cholesterol, little fat, and few calories. They are the second most important source of human dietary protein worldwide and the third most important source of calories.
The Bean/Cowpea Collaborative Research Support Program (CRSP) was established by the United States Agency for International Development in 1980. The purpose of the Bean/Cowpea CRSP has been to increase the availability and utilization of high quality dry beans and cowpeas worldwide. “Cowpeas” are various Vigna spp. including the crop known commonly in the United States as “black-eyed pea" and they have properties similar to dry beans. The Bean/Cowpea CRSP has collaborative research programs in three regions of the world: East and Southern Africa, West Africa, and Latin America/Caribbean.
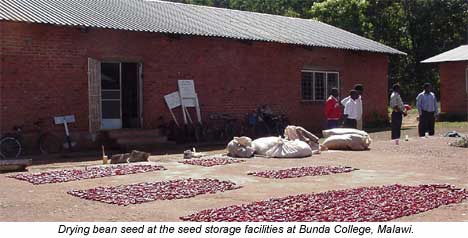
WSU - Bean/Cowpea CRSP’s Work in Africa
 Washington
State University (WSU) has been a major participant in the Bean/Cowpea
CRSP in East Africa since the program’s inception. WSU scientists
have conducted research and education activities to directly benefit farmers
in East Africa as well as farmers in the United States. Today the WSU
component of the Bean/Cowpea CRSP is working with scientists at the University
of Malawi and Sokoine University of Agriculture in Tanzania to investigate
dry bean seed production and dissemination systems, to investigate seed
quality issues, and to develop new improved dry bean varieties.
Washington
State University (WSU) has been a major participant in the Bean/Cowpea
CRSP in East Africa since the program’s inception. WSU scientists
have conducted research and education activities to directly benefit farmers
in East Africa as well as farmers in the United States. Today the WSU
component of the Bean/Cowpea CRSP is working with scientists at the University
of Malawi and Sokoine University of Agriculture in Tanzania to investigate
dry bean seed production and dissemination systems, to investigate seed
quality issues, and to develop new improved dry bean varieties.
I have led WSU’s Bean/Cowpea CRSP efforts in recent years, conducting research primarily at the university’s Vancouver Research and Extension Unit. My group’s efforts have been directed at developing sustainable dry bean production systems in the African nations of Malawi and Tanzania as well as here in Washington State by:
- Establishing participatory on-farm research trials to evaluate variety performance and to provide feedback to breeders to promote effective bean selection and breeding processes.
- Multiplying foundation, certified, and quality-declared seed or farmer-approved seed of Bean/Cowpea CRSP varieties to enhance maximum dissemination to rural communities.
- Studying the potential to reduce disease pressure from halo blight (Pseudomonas syringae) in the field and greenhouse.
 |
 |
In 2002, Dr. Phil Miklas, a Plant Research Geneticist with the U.S. Department of Agriculture’s Agricultural Research Service (USDA-ARS), joined the Bean/Cowpea CRSP team. Dr. Miklas, based out of the WSU Irrigated Agriculture Research and Extension Center that USDA-ARS shares with WSU in Prosser, will be working in Tanzania and Washington to develop new improved bean varieties. Our collaborations with Dr. Miklas, such as on-farm trials in Moses Lake and Lopez Island, will expand the Bean/Cowpea CRSP’s impact both at home and abroad.
WSU/CRSP’s Work in Washington State
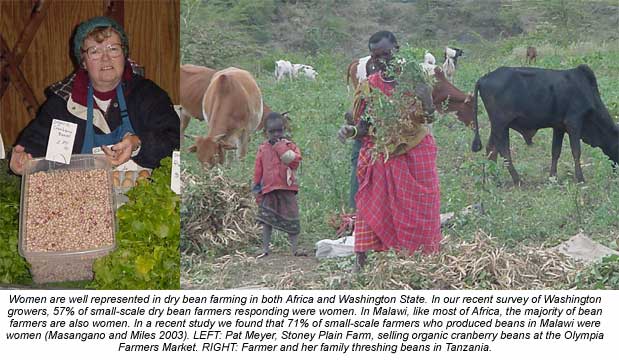
Here in the United States, per capita consumption of dry beans has increased from 5.1 pounds per person in 1984 to 8.1 pounds per person in 1999, a 58% increase. This increasing popularity creates a viable opportunity for expanding dry beans into niche markets. Dry beans are healthful and are available in many different colors and sizes, making them a viable alternative crop from a marketing standpoint for direct market farmers who are able to capture a high price for their produce. For example, in 2002 organic cranberry dry beans sold in the Olympia and Seattle farmers markets for $2.55 per pound. Dry beans are also suitable for niche markets from a production standpoint as they are relatively easy to grow and store. While dry beans are generally considered a large-scale bulk commodity crop, they need little in the way of specialized equipment, require low inputs, and store well, making the crop feasible for small-scale production.
This article will center on my group’s efforts in Vancouver, discussing the findings of our recent variety trials, halo blight disease research, and marketing studies directed at expanding niche markets in western Washington State.
Dry Bean Variety Trials
At Washington State University we have been investigating the potential to produce niche market dry bean varieties over the past three seasons, conducting our preliminary trials at the WSU Vancouver Research and Extension Station in western Washington. In Washington, as throughout the United States, dry beans are mainly grown on a large scale for bulk commodity markets; most of the large-scale production in Washington takes place in the Columbia Basin. In 2002, 82 million pounds of dry beans were produced on 41,000 acres and were valued at $16.6 million. In a survey that we conducted in 2002 we found that thirty-seven small-scale farmers grew dry beans in Washington for niche markets; of these, twenty-nine were located in western Washington. Much is known about large-scale bean production but little information is available regarding small-scale niche market production. A primary criterion for variety suitability in Washington (especially western Washington) is early maturity. Cool summer temperatures in the western part of the state result in slower growth; most varieties are harvested fifteen or more days later here than in the Midwest.
We planted 53 varieties of dry bean in 2001, 64 varieties in 2002, and 115 varieties this year (2003). Each year’s experimental plots were planted in a randomized complete block design with four replications. Plots were two rows wide and ten feet long, with two feet between rows and two inches of spacing within the rows. Our field site is certified organic and has been maintained accordingly. The plots were mechanically cultivated once a week to control weeds between rows and hand weeded to control in-row weeds as needed from July through August. We measured and recorded the number of days after planting (DAP) to emergence, date of first flower, date by which 50% of plants had flowered, date of harvest, number of plants in the stand, and height of plants. We harvested the bean plants from the center five feet of each double-row plot for a total harvest area of ten linear feet per plot. Whole plants were harvested, placed in burlap bags, and dried in field ovens for sixteen hours at 68o C, until seed moisture was approximately 12%. We then selected ten pods at random from each plot harvest and measured pod length. We threshed and cleaned all the beans from each plot by hand and measured the total marketable bean weight. We also measured the weight of one hundred beans and the length and width of twenty-five beans from each plot.
Dry beans were harvested 105 to 139 days after planting, depending on variety (Table 1, at the end of this article following the references). We harvested at maturity, which, in the case of dry beans, means when pods are fully dried but have not yet shattered (harvesting after pod shatter leads to lower yield). Mean yield for a 10-foot row was about 1 lb., but yield differed significantly among varieties. In 2001, Pinks and Cranberry were the highest yielding types of beans whereas in 2002, Dark Red Kidney and White Kidney were the highest yielding types. Disease pressures emerged in the 2002 trials that are discussed in greater detail in the following section.
Our trial results indicate that more than fifty varieties of dry beans can be produced in western Washington. We found that the limiting factor to small-scale production of dry beans is suitable and affordable small-scale threshing equipment. A complete report of our variety trial is on the Web at http://SustainableSeedSystems.wsu.edu/nicheMarket/02DBVarietyReport.pdf.
 Halo
Blight Study
Halo
Blight Study
Halo blight (Pseudomonas syringae) can be a serious pest in dry beans, reducing yields and/or rendering the beans unmarketable. The first symptom is water-soaked spots followed by irregular brown spots on leaves' undersides. Later, spots show through the upper surface, usually surrounded by the characteristic yellow halo and often covered with a superficial bacterial sheen. Defoliation occurs in severe infections. Leaves on systemically infected plants may show yellowing and malformation without the appearance of necrotic symptoms. Infected plants often are stunted. Pods may turn dark and greasy-looking, with water-soaked spots and a bacterial ooze. Reddish, waxy cankers can develop on the stems, girdling and killing the bean plants. Halo blight is of concern to us because it is seed borne. If a farmer stores seed from infected plants, then the disease is very likely to affect the next crop very early in the season, when crop health and yield can be most seriously impacted. In a survey that we conducted in Washington in 2002 (discussed in the next section) we found that almost half of small-scale farmers saved dry bean seed from their fields.
In our variety trials described above, we first observed virus and halo blight symptoms on our bean plants in the field on July 1, 2002. Symptoms increased in severity and spread through the field as the season progressed. Cannellini, Dwayne Baptiste, Speckled Bays, Tongue of Fire, Celina’s Romano, Maine Yellow Eye, Nugget, and Serene were affected by halo blight. Cannellini, Andrew Kent, Speckled Bays, Orca, Trout/Jacob’s Cattle, Beka, Hutterite, Maefax, and Zert were affected by a poty virus. (Mosaic viruses such as bean common mosaic virus and bean yellow mosaic virus are caused by various species of the genus Potyvirus.) The incidence of disease in the 2002 trials led us to initiate a greenhouse research project in the winter of 2003. We concentrated on halo blight.
Our research team selected a random sample of seed from each of the eight varieties of dry beans that exhibited halo blight in our 2002 field trials and planted them in the greenhouse in January 2003. The study design was a randomized complete block with six replications. Beans were planted in one-gallon pots. Plants were observed for symptoms of halo blight throughout the growing period and seed was harvested in May. No halo blight symptoms were observed on plants or seeds. However, seeds carrying halo blight do not necessary exhibit visible symptoms. The next step will be to conduct laboratory analysis to determine whether the resulting seeds are free of halo blight.
Our objective in conducting this study was to determine if we could reduce the disease pressure due to halo blight by growing seed in an environment not conducive to disease development, i.e., in a greenhouse. If this method proves effective, we hope to provide our African colleagues with a simple technique that they can use to reduce the disease pressure in their seed stocks. In Tanzania and Malawi, seed is produced in the field and the environmental conditions are highly conducive to halo blight as well as other diseases. However, the African researchers have screenhouses on site, which they may be able to use in the off-season to grow beans for seed stock.
Dry Bean Niche Marketing in Washington
Toward the goal of expanding niche marketing of dry beans in Washington State, we have conducted both information gathering and information dissemination. Surveying growers was a vital first step in understanding producers' concerns. Providing information to both consumers and growers was the next step.
To better understand farmers’ problems in growing, storing, and marketing dry beans, we developed a short (thirteen questions) questionnaire and distributed it to 124 farmers. The survey was distributed via U.S. mail, then followed up through email (30) and telephone interviews (88). We found that telephone interviews were the most successful method of obtaining survey responses (65% response).
Forty-six farmers from eighteen counties in Washington responded to our survey. Seventeen (37%) respondents were located in eastern Washington and 29 (63%) were in western Washington. Eleven of the respondents in eastern Washington were in the Columbia Basin, of which nine were large-scale farmers who grew dry beans on 18 to 450 acres each, 155 acres on average. In contrast, 37 farmers who responded to our survey were small-scale farmers, each with a total dry bean production area of a minimum of 10 row-feet and a maximum of 1.25 acres, 0.13 acre on average.
All the large-scale farmer respondents were men, while just over half (57%) of the small-scale farmer respondents were women. These results imply that women actively participate in small-scale dry bean farming and do not participate in large-scale farming. Important findings from this survey were that small-scale farmers are currently growing dry beans in Washington, that most of these small-scale farmers were located in western Washington, that most were organic growers, and that most faced no serious problems with regard to pests either in the field or in storage. This survey did not adequately capture the large-scale dry bean producers in the state and therefore we feel that these survey results do not necessarily reflect the production issues experienced by large-scale farmers. A complete report from our survey can be found on the Internet at http://SustainableSeedSystems.wsu.edu.
Because of the relative ease of production and storage of dry beans and their long marketing window, dry beans have the potential to become an important crop for many small-scale farmers in the Pacific Northwest and elsewhere in the United States.
Next, we set out to spread the word about our research, educating both producers and consumers about dry beans. We have developed a Web page at http://SustainableSeedSystems.wsu.edu/nicheMarket/index.html on which you will find
 a
publication entitled “Dry Bean Varieties for Niche Markets in
the USA,” which describes and depicts (in a color photograph)
56 different dry bean varieties, emphasizing those most suitable for
niche markets based upon our research;
a
publication entitled “Dry Bean Varieties for Niche Markets in
the USA,” which describes and depicts (in a color photograph)
56 different dry bean varieties, emphasizing those most suitable for
niche markets based upon our research;- a consumer-oriented tri-fold brochure on dry beans, including their nutritional properties, how to reduce the flatulence they can cause, and how to select, cook, and store them;
- the complete report on our variety trials; and
- our grower survey.
We are committed to expanding knowledge among consumers and growers about dry beans. In addition to the Web page and marketing described above, we have conducted educational presentations on dry beans at small farm conferences, home garden workshops, and diabetes seminars. By promoting dry beans “from the ground up,” we believe we can grow the market for this commodity as a tasty, nutritious, economical food and a profitable niche-market crop.
Carol Miles and Madhu Sonde are with the WSU Vancouver Research and Extension Unit. They can be reached at milesc@wsu.edu or (360) 576-6030.
AcknowledgementsThis research and education program was made possible through support provided to the Bean/Cowpea Collaborative Research Support Program (CRSP) by the Bureau for Economic Growth, Agriculture, and Trade, U.S. Agency for International Development, under the terms of Grant No. DAN-G-SS-86-00008-00/GDG-G-00-02-00012-00. The opinions expressed herein are those of the authors and do not necessarily reflect the views of the U.S. Agency for International Development. |
REFERENCES
Belshe, D., M. Boland, S. Daniel and D. O’Brien. 2001. Economic issues with dry-edible beans. Kansas State University.
CIAT 1993. Trends in CIAT commodities. Working Document No. 128. CIAT, Cali. Colombia.
Masangano, C. M. and C. A. Miles. 2003. Factors influencing farmers' adoption of Kalima bean (Phaseolus vulgaris L.) variety in Malawi. Journal of Sustainable Agriculture. In press.
Pachico, D. 1993. The demand for bean technology. In: Henry G., ed. Trends in CIAT commodities 1993. CIAT, Cali, Colombia. pp. 60-73.
USDA. 2003. Dry edible beans: Area planted and harvested, yield, and production by state and United States, 2000-2002. http://usda.mannlib.cornell.edu/reports/nassr/field/pcp-bban/cropan03.txt
TABLE 1 |
|||||||
| Harvest
days after planting (DAP), total dry bean weight (grams) from 10-feet
row and weight of 100 beans (grams) of dry beans grown at WSU Vancouver REU in 2001 and 2002. |
|||||||
| Type and Variety | Harvest
DAP
|
Total
Bean Weight (g)
|
100-Bean
Weight (g)
|
||||
| 2001 |
2002 |
2001 |
2002 |
2001 |
2002 |
||
| Dark Red Kidney | 115 |
||||||
 |
Montcalm | 112 |
115 |
431.2 |
786.1 |
51.9 |
84.9 |
| Light Red Kidney | 113 |
||||||
 |
CELRK | 110 |
115 |
437.9 |
499.4 |
63 |
59.5 |
 |
Kardinal | 117 |
116 |
479.9 |
586 |
57 |
63.2 |
 |
Kintoki | 108 |
672.6 |
67.5 |
|||
| White Kidney | 118 |
||||||
 |
Cannellini | 115 |
118 |
320.4 |
528 |
59.3 |
52.2 |
 |
Dwane Baptiste | 118 |
708.1 |
57 |
|||
| Small White/Navy | 116 |
||||||
 |
Arthur | 112 |
118 |
481.5 |
496 |
14.7 |
16.8 |
 |
Norstar | 112 |
115 |
465.6 |
364 |
17.8 |
17.7 |
| Small Red/Red Mexican | 110 |
||||||
 |
LeBaron | 110 |
108 |
344.4 |
401.5 |
34.7 |
61.3 |
 |
Montezuma Red | 111 |
110 |
401 |
606.2 |
36.3 |
35 |
 |
NW-63 | 116 |
113 |
655 |
513.2 |
34.6 |
33.6 |
| Pink | 112 |
||||||
 |
UI-537 | 115 |
110 |
592.9 |
369.7 |
36.4 |
33.3 |
 |
Pinks | 115 |
459.2 |
33.3 |
|||
| Black | 114 |
||||||
 |
UI-911 | 118 |
119 |
487.1 |
605.8 |
20.1 |
20.4 |
 |
Black Coco | 118 |
118 |
416.7 |
584.5 |
54.3 |
56.1 |
 |
Major | 105 |
649.1 |
36 |
|||
 |
Midnight Black Turtle | 118 |
117 |
517.4 |
633.8 |
17.9 |
18.8 |
| Cranberry | 116 |
||||||
 |
Andrew Kent | 120 |
123 |
572.6 |
685.3 |
58.3 |
74.4 |
 |
Candy | 119 |
436.1 |
139 |
|||
 |
Cardinal | 119 |
117 |
452.8 |
506.6 |
63.8 |
62 |
 |
Etna | 114 |
112 |
639.5 |
608 |
69.7 |
62.5 |
 |
Speckled Bays | 116 |
114 |
357.1 |
400.5 |
49.5 |
49.4 |
 |
Thort | 114 |
113 |
452.2 |
532 |
55.3 |
53.7 |
 |
Tongue of Fire | 116 |
113 |
502.9 |
294.9 |
58.8 |
52 |
 |
Vermont Cranberry | 112 |
116 |
457.1 |
530.5 |
48.8 |
48.5 |
| Yellow Eye/Partially Colored | 114 |
||||||
 |
Celina's Romano | 114 |
161.3 |
54.3 |
|||
 |
Magpie | 119 |
746.4 |
35.2 |
|||
 |
Maine Yellow Eye | 114 |
114 |
285.5 |
401.5 |
43.5 |
46.9 |
 |
Molasses Face | 108 |
562.8 |
45.7 |
|||
 |
Old Fashioned Soldier | 114 |
113 |
575.9 |
634.6 |
66.2 |
55 |
 |
Orca (USWA-27) | 117 |
116 |
435.2 |
563.1 |
32.5 |
35.4 |
| (no photo) | Red Soldier | 113 |
510.1 |
59.5 |
|||
 |
Trout/Jacobs Cattle | 114 |
112 |
394.3 |
357.7 |
66.5 |
66.7 |
| Brown or Yellow Beans | 112 |
||||||
 |
Beka | 112 |
617.6 |
42.4 |
|||
 |
Childer's Golden | 114 |
224.8 |
21.6 |
|||
 |
Hutterite | 117 |
308.5 |
47.2 |
|||
 |
Ireland Creek | 112 |
554.1 |
54.5 |
|||
 |
Lake Kivu | 111 |
541.7 |
52.1 |
|||
 |
Maefax | 109 |
550.9 |
41.8 |
|||
 |
Norwegian | 108 |
664.2 |
37.8 |
|||
 |
Zert | 112 |
549.6 |
44.8 |
|||
| Flageolet | 122 |
||||||
 |
French Flageolet | 115 |
122 |
518.1 |
417.1 |
25.4 |
31.5 |
 |
French Shell Flambeau | 131 |
575.6 |
27.6 |
|||
| (no photo) | Nugget | 113 |
256.2 |
32 |
|||
| Other | 117 |
||||||
 |
G18689 | 115 |
119 |
681.3 |
756.2 |
23.6 |
40.9 |
 |
Mansel Magic | 113 |
627.7 |
100.2 |
|||
 |
Mrocumiere | 121 |
628.9 |
54.7 |
|||
 |
Royal Burgundy | 139 |
374 |
49.3 |
|||
 |
Serene | 112 |
327.4 |
66.2 |
|||
| (no photo) | Stevenson Blue Eye | 119 |
487.4 |
50.3 |
|||
| Mean | 115 |
111 |
446 |
497.7 |
47 |
47.5 |
|
| P Value | 0.0001 |
0.0001 |
0.0001 |
0 |
0.0001 |
0 |
|
Go to this issue's Table of Contents
Go to Agrichemical and Environmental News Index
Go to WSPRS (Washington State Pest Management Resource Service) Home Page
Pesticide Use and IPM Practices in Washington’s Pear and Cherry Orchards
Dr. Jay F. Brunner, Dr. John Dunley, Wendy Jones, Dr. Elizabeth Beers, Gerald V. Tangren, Dr. Chang-lin Xiao, and Dr. Gary G. Grove
In a previous Agrichemical
and Environmental News article (Brunner et al. 2003), we discussed
a decade of IPM practices on apple in Washington. This companion article
discusses a decade of IPM practices in pear and presents some new data
on sweet cherry.
Passage of the Food Quality Protection Act (FQPA) of 1996 has probably
impacted the use and availability of pesticides on apple to a greater
extent than on pear and cherry. While pear is an important food in the
diets of infants and children, insect management programs in pear rely
less upon organophosphate insecticides than those in apple. And while
organophosphate and carbamate insecticides are used on sweet cherry, this
crop is not considered as important in the diets of infants and children
as pome fruits such as apple and pear.
Pear and Cherry Pest Management Today
A comprehensive pear pesticide use survey was conducted in Washington in 1990 (Beers and Brunner 1991). The United States Department of Agriculture National Agricultural Statistics Service (NASS) initiated pesticide use surveys in 1991 and has conducted these every other year on fruit crops (NASS 1992, 1994, 1996, 1998, 2000, 2002). While the NASS surveys provide general use data for pesticides and track changes in usage over time they lack the data necessary to assess pesticide use patterns or IPM practices within individual states provided by the 1990 survey in Washington. No comprehensive survey has been conducted for pesticide use and IPM practices on sweet cherry production in Washington.
The lack of data on pesticide use patterns and IPM practices has had many ramifications. Without data it is difficult to counter claims by anti-pesticide groups about how pesticides are actually being used. As educators it is important for us to document what IPM practices are being followed, over time, in Washington tree fruit crops in order to design and evaluate our outreach programs. The reasons for new data on pesticide use and IPM practices were further outlined in the previous article (Brunner et al. 2003).
The 2000 Survey
We prepared separate pest management practices surveys for pear and cherry using previous surveys as templates (Beers and Brunner 1991). We updated the technical content using the 2000 Crop Protection Guide (Smith et al. 2000). Each survey was reviewed by industry experts for accuracy and applicability. A standardized format was adopted for the surveys to allow for easier comparison and data entry; the format was designed to be as grower-friendly as possible and an electronic version of each survey was made available via the World Wide Web.
Each survey consisted of three parts: Part 1 dealt with general questions regarding the grower’s overall orchard operations; Part 2 pertained to a specific block (i.e., growing unit); and Part 3 contained detailed questions about pest management and horticultural practices broken into time intervals corresponding to growth stages and spray periods. (Examples of the survey questionnaires can be downloaded at Internet URL http://opus.tfrec.wsu.edu/~wjones/Survey2000/.)
Survey recipients for pear and sweet cherry were selected randomly from lists of growers and orchard managers provided by a statewide industry organization of tree fruit growers. In early March 2001, 863 pear and 499 cherry surveys were mailed. Return postage was pre-paid, responses were anonymous, and recipients were given approximately 45 days to respond. Growers answered questions based on the previous (2000) growing season.
Characterization of Farming Operations
Part I of the survey directed respondents to answer questions intended to characterized their farming operations as to general location; as being full-time or part-time; and as being conventional, organic, or transitional to organic. They were also asked which fruit crops and varieties, along with how many acres of each they grew.
Pest Management Advice
Fruit growers in Washington receive information and advice from private consultants, agricultural chemical industry fieldmen, fieldmen employed by growers or packinghouses, and university Cooperative Extension agents. Survey recipients were asked to rate these various information sources as being “very important,” “somewhat important,” or “not important” in helping to make pest control decisions.
Pest Management Activities
Washington state tree fruit growers employ a variety of pest management practices to help reduce reliance on pesticides as their sole pest control tactic. Growers were asked which practices they used including orchard monitoring, alternate row spraying, reduced pesticide rates, biological control, integrated mite management, economic thresholds, degree-day models, and pheromone traps.
Reporting Block Information
Each grower was asked to report on a block (i.e., portion) of the farm that represented his or her typical pesticide use pattern. Questions included size of block, planting density, varieties planted, percentage of each variety planted, irrigation methods, cover crop management, and tree training system.
Reporting of Pesticide Use
We requested that the growers report the tree phenology, date, method of application, volume applied per acre, percentage of acreage applied, chemical name, amount of formulated material per acre, and target pest for each occasion a pesticide application was made.
Data Analysis
Surveys were screened to eliminate incomplete, imprecise, or unanswered questions. Once screened, survey data were coded and entered into a spreadsheet for analysis. The amount of active ingredient (AI) of each chemical was determined by multiplying the amount of formulated product used per acre as a portion of pound or gallon by the pounds of AI per pound or gallon in the formulation.
Pear Pesticide Use and IPM Practices
In 1990, of the 1,068 surveys sent to active pear growers, 331 (31%) were completed and returned. These 331 growers produced pears on 9,682 acres representing approximately 39.3% of the total acres of pears grown in Washington (WASS 1995). In 2000, of the 863 surveys sent to prospective pear growers, 190 (22%) were returned, but of those only 129 (15% of the total sent) were complete and usable. The responses came from eight major growing regions across the state, representing a total of 3,160 production acres, or about 12.9% of the bearing pear acreage in Washington (WASS 2001). While the 2000 survey returns for pear were lower as a proportion of the total state acreage than those in 1990, the data should still reflect current trends in pesticide use and IPM practices in Washington pear production.
Changes in Farming Operations
The percentage of respondents reporting as full-time growers increased slightly from 82.5% in 1990 to 88.8% in 2000. There was a corresponding slight decrease in respondents categorizing themselves as part-time growers in 2000, 11.2%, compared with 17.5% in the 1990 survey. This means that about the same proportion of pear growers was dependant on off-farm income in both years. The average farm size of full-time growers was 137 acres compared to 24 acres for part-time growers. Most of the 2000 survey respondents (79.9%) characterized themselves as using conventional pest control practices. The remainder of growers were either certified organic (4.3%), were transitional organic (2.7%), or had some pear production under conventional and some organic management (13.4%) (Table 1). The most significant change from the 1990 survey was the increase in the number of growers involved in organic and transitional to organic production. In 1990, only 4.2% of the growers reported being involved in any organic production, while in 2000, over 20% reported activity in organic production. These data agree with other survey results showing a rapid increase in organic pear production in the late 1990s (Granatstein and Kirby 2002).
TABLE 1 |
||||
| Comparison
of the relative proportion of farmers utilizing different farming
practices in pear and the pear acreage represented for the 1990
and 2000 crop years. |
||||
| Farming Practice |
1990
|
2000
|
||
|
%
Growers |
Mean
Acres |
%
Growers |
Mean
Acres |
|
| Full-Time |
82.50% |
128.2 |
88.80% |
136.8 |
| Part-Time |
17.50% |
14.8 |
11.20% |
23.7 |
| Conventional | 95.80% |
4,738.80 |
79.90% |
2,522.80 |
| Mixed | NR |
NR |
13.4 |
414.8 |
| Transitional | 0.06% |
3 |
2.70% |
86 |
| Organic | 4.10% |
204.3 |
4.30% |
134.9 |
Pest Management Advice
Potential sources of pest management
information and advice and the survey respondents’ ranking of their
usefulness are summarized in Table 2.
TABLE 2 |
||||||
| Comparison
of percentage of survey respondents who rated the value of information
from different sources in helping them make pear pest management
decisions during 1990 and 2000. |
||||||
| Information Source | 1990 |
2000 |
||||
| Very
Important |
Somewhat
Important |
Not
Important |
Very
Important |
Somewhat
Important |
Not
Important |
|
| Private Consultant (PC) | 42 |
14 |
44 |
44 |
13 |
32 |
| Agricultural Chemical Fieldman (ACF) | 49 |
34 |
17 |
48 |
31 |
15 |
| Cooperative Extension (CE) | 28 |
50 |
22 |
28 |
46 |
15 |
| Packinghouse Fieldman (PF) | 49 |
27 |
24 |
33 |
41 |
18 |
| Other Growers (OG) | 19 |
63 |
18 |
11 |
63 |
17 |
| WSU Crop Protection Guide (CPG)1 | NA2 |
- |
- |
44 |
34 |
12 |
| Orchard Pest Management (OPM)3 | NA |
- |
- |
20 |
41 |
29 |
| Outside Management | NR4 |
- |
- |
1 |
0 |
0 |
| Own Experience | NR |
- |
- |
6 |
0 |
0 |
| 1Crop
Protection Guide for Tree Fruits in Washington is a publication
of Washington State University Cooperative Extension. The latest edition
can be found on-line at http://cru.cahe.wsu.edu/CEPublications/eb0419/eb0419.pdf. 2NA = This resource was not available in 1990. 3Orchard Pest Management: A Resource Book for the Pacific Northwest is published by The Good Fruit Grower, Yakima, Washington. 4NR = Data not reported in 1990. |
||||||
A majority of growers identified professional crop consultants (private consultants, agricultural chemical fieldmen, packinghouse fieldmen) as being “very” or “somewhat” important resources for making pest management decisions in both years. Washington State University’s Crop Protection Guide and Cooperative Extension were identified by a majority of growers (78% and 74%, respectively) as being “very” or “somewhat” important in helping them make pest management decisions as well. Growers seem to rely more upon advice from other growers relative to their own experience, an interesting and somewhat perplexing finding.
Pest Management Practices
Table 3 summarizes use of pear pest management practices in 1990 and 2000. Whether conducted by the grower or a professional crop consultant, orchard monitoring was the most often used pest management practice, being identified by over 90% of the growers in both years. Alternate row spraying is a technique frequently used in parts of the eastern United States as a method for decreasing the overall amount of pesticide applied (Asquith and Hull 1979). The percent of growers reported using this method in pear declined slightly from the 1990 to 2000 survey, 44% to 38%. Reducing pesticide rates is a common practice in tree fruit pest management and, along with the choice of more selective chemicals, helps conserve certain beneficial species important in controlling pests such as pear psylla. The percent of growers that reported using reduced rates stayed the same, 67%, in both years. There was also no change in the percent of growers reporting the use of economic thresholds in their decision making for pest control. There was a slight increase in the percent of the growers who reported using pheromone traps in 2000, to 78% from 68%. The percent of growers indicating use of biological control in their pest management efforts increased from 58% to 64% over the decade. Questions about the use of degree-day models and integrated mite management were new in the 2000 survey. Seventy-seven percent of pear growers reported using degree-day models and 64% reported using integrated mite management. These results show that Washington pear growers are using slightly more IPM practices than a decade ago and the most important IPM practices (monitoring, biological control, use of models and economic thresholds) are used by over 60% of the growers.
TABLE 3 |
||
|
Percentage
of pear growers who reported using non-conventional pest management
practices. |
||
| Management Practice |
1990 |
2000 |
| Orchard Monitoring | 96% |
94% |
| Alternate Row Spraying | 44% |
38% |
| Economic Threshold | 68% |
68% |
| Biological Control | 58% |
64% |
| Reduced Chemical Rates | 67% |
67% |
| Pheromone Traps | 68% |
78% |
| Degree-Day Models | NR1 |
77% |
| Integrated Mite Management | NR |
64% |
| 1NR = Data not reported in 1990. | ||
Use of Mating Disruption
Mating disruption was not available in 1990 as a control for codling moth but questions about its use in pear were included in the 2000 survey. By 2000, about 50% of apple acreage in the state had adopted codling moth mating disruption, but this technique’s use in pear was not well documented. Pear growers surveyed were asked if they used mating disruption and if that use had increased or decreased since they first began using it. Results are shown in Table 4. Sixty-four percent of the pear growers reported using mating disruption and they had used it for an average of almost three years. The majority of the growers (75%) reported an increase in their use of mating disruption. Of those that reported decreased use of mating disruption, most cited that the orchard had been removed, that the method was too expensive, or that they experienced increased damage by codling moth or (more typically) other pests (Table 4).
TABLE 4 |
||
| Summary
of mating disruption use replies by apple growers. |
||
| Was mating disruption used? | #
of Growers Responding |
Percent
of Growers |
| No | 46 |
35.70% |
| Yes | 83 |
64.30% |
| Number of years using mating disruption | Mean |
Std
Dev |
2.8 |
2.1 |
|
| How did the # of mating disruption acres change from first adopting its use? |
#
of Growers Responding |
Percent
of Growers |
| Decreased | 14 |
17.50% |
| Stayed the same | 6 |
7.50% |
| Increased | 60 |
75.00% |
| If decreased, why? | ||
| Mating disruption trees were removed | 5 |
38.50% |
| Increased damage by codling moth | 2 |
15.40% |
| Increased damage by other pests | 5 |
38.50% |
| Too expensive | 3 |
23.10% |
| Monitoring was not reliable | 2 |
15.40% |
| Other reasons | 2 |
15.40% |
Target of Pesticide Application
Growers were asked to indicate the pest target for each of their chemical applications. They were given a list of targets categorized as insect/mite or disease. If their target was not listed, they were asked to write in the pest name under the appropriate heading. Table 5 summarizes grower responses. Pear psylla was the most frequently cited insect pest with 95% of the growers indicating it was a target for pesticide application an average of 4.8 times during 2000. This was similar to the figures reported in 1990 with 98% of the growers citing pear psylla as a target an average of 4.3 times. Codling moth was also cited as a target of pesticide applications, with treatment an average of 2.2 times and treatment by 74% of the growers. Both numbers represent a slight increase from 1990. Spider mites were listed as a target by more than half of the pear growers and the average times it was identified as a target was almost twice per season. The percent of growers citing leafrollers as a target of an insecticide application increased from 4.2% (1990) to 26.7% (2000) (Table 5), indicating the increased concern pear growers have for this pest.
The disease most cited as a
target in 2000 was fire blight, with 51% of the growers citing it and
treatment averaging 1.7 times during the season. The second most prevalent
disease was powdery mildew (42% growers, 1.5 treatments). It is interesting
to note that powdery mildew plagued an equal proportion of growers both
survey years.
TABLE 5 |
||||
| Number
of times growers cited a pest as being the target and percentage
that said a pest was a target at least once. |
||||
| Target Pest | Average
# times grower cited pest as target |
%
growers citing pest as target |
||
| 1990 |
2000 |
1990 |
2000 |
|
| Insect/Mite | ||||
| Aphids | 1.2 |
1.4 |
8.20% |
5.40% |
| Codling Moth | 2.1 |
2.2 |
64.20% |
74.00% |
| Cutworms | 1.1 |
1.1 |
14.80% |
12.10% |
| Lacanobia Fruitworm | NR1 |
1.7 |
NR |
2.10% |
| Leafhopper | 1 |
1 |
0.30% |
1.10% |
| Leafroller | 1.4 |
1.9 |
4.20% |
26.70% |
| Lygus Bug | 1.5 |
1.3 |
28.80% |
11.30% |
| Mealybug | 1.9 |
3.3 |
32.10% |
28.20% |
| Pear Psylla | 4.3 |
4.8 |
98.20% |
94.60% |
| Rust Mites | 1.9 |
2 |
53.90% |
46.60% |
| San Jose Scale | 1.4 |
1.2 |
43.00% |
61.20% |
| Spider Mite | 2.3 |
1.9 |
64.20% |
55.30% |
| Stink Bug | NR |
1.1 |
NR |
8.70% |
| Unknown | NR |
1.1 |
NR |
5.90% |
| Disease | ||||
| Bulls Eye Rot | 1.4 |
1.2 |
30.30% |
25.10% |
| Fire Blight | 2.5 |
1.7 |
67.00% |
51.30% |
| Pear Scab | 2 |
1.3 |
5.80% |
5.50% |
| Powdery Mildew | 1.3 |
1.5 |
41.80% |
41.80% |
| Pseudomonas | 1.2 |
1 |
1.80% |
2.30% |
| Unknown | NR |
1 |
NR |
4.40% |
| 1NR = Data not reported in 1990. | ||||
Timing of Pesticide Applications
A frequent criticism of agrichemical programs is that applications are made too close to harvest, increasing the possibility that toxic residues could remain on the fruit. Insecticides are probably the most important of the agricultural chemicals in terms of concerns over toxic residues on fruit. Table 6 summarizes the average last spray date for each class of pesticide used in pear orchards along with the range of when those dates occurred. In Washington, the Bartlett pear harvest usually begins around mid-August while winter pear harvest begins in early September. The average last spray dates for insecticides were about three weeks prior to the initiation of Bartlett harvest. Some of those insecticides applied in early August were applied to winter pears, the harvest of which began in early September. Orchards with interplanted Bartlett and winter pear often have to consider the pre-harvest interval on the earlier Bartlett, and still use pest control tactics that are estimated to be robust enough to manage insect populations through the winter pear harvest. Additionally, harvest labor management may prevent insecticide applications between Bartlett harvest and winter pear harvest, increasing the number of applications made before Bartlett harvest. Fungicides that are applied predominantly for powdery mildew or fire blight have the earliest average last date of application but some are applied late, especially those intended to manage bull’s-eye and other post-harvest rots. Nutrients are commonly applied with pesticides targeting insects or disease organisms, or they are applied late in the season to help enhance fruit quality; therefore the average last application date for nutrients falls between that for insecticides and fungicides. Plant growth regulators (PGRs) have a late last application date in part because one product, NAA, is used to retain fruit on the tree prior to harvest.
TABLE 6 |
||
|
Average
and range for the last application date for each chemical class
during 2000. Harvest of Bartlett pear generally begins around mid-August;
winter pear harvest begins early September. |
||
| Pesticide Class |
Average
date of last spray |
Last
date range |
| Insecticide | 21
July |
10
July to 5 August |
| Fungicide | 31
May |
11
April to 10 August |
| Nutrients | 13
July |
21
June to 17 August |
| PGR | 5
August |
1
July to 25 August |
Chemical Application Methods
Most (95%) agricultural chemical applications were made to the entire orchard with only about 4% being applied to half the block or less. Less than 1% of applications were made to borders only. Eighty percent of pesticides are applied by air-blast sprayers and most of the rest (16%) were herbicides applied by boom sprayer. Only 1.3% of pesticides were reported as applied by air. About 26% of all pesticide applications to pear use less than 99 gallons of water per acre when applying pesticides. Forty-one percent of spray applications use between 100 and 200 gallons of water per acre.
Insecticide and Miticide Use in 1990 and 2000
The 1990 and 2000 survey results for insecticide and miticide usage are shown in Table 7. Since 1990, relatively few insecticides or miticides have lost their registration for use on pear. Parathion (Parathion), oxamyl (Vydate), phosphamidon (Phosphamidon), oxythioquinox (Morestan), and rotenone (Rotenone) are the most notable products that were used to some extent in 1990 but were not used for various reasons in 2000. Increased restrictions have been placed on some products like azinphos-methyl (Guthion), endosulfan (Thiodan), and formetanate hydrochloride (Carzol). On the other hand, several insecticides and miticides have been registered for use on pear since 1990, e.g., tebufenozide (Confirm), imidacloprid (Provado), pyridaben (Pyramite), kaolin (Surround), and pyriproxifen (Esteem). Many of these were registered primarily to control pear psylla, the key pest of pear. It should also be noted that two of the insecticides used for pear psylla control in 1990, cyfluthrin (Baythroid) and abamectin (Agri-Mek), were made available then by Section 18 Petitions for Emergency Exemption from Registration. Agri-Mek was approved for full registration in 1995 and has remained a cornerstone of pear pest management. Baythroid, however, never received registration on pear in part because it had lost effectiveness due to increased resistance of pear psylla to pyrethroid insecticides.
Oil (mineral oil) accounted for 88% and 64% of pounds of active ingredient (AI) of all pesticides in 1990 and 2000, respectively. Each pint of oil applied is considered to be equal to one pound of AI so an application of 4 gallons of oil per acre equals 32 pounds AI of the insecticide per acre. Oil is commonly used on pear in the pre-bloom period primarily as part of an IPM program that provides selective control of pests such as pear psylla, scale, and spider mite. Therefore, pome fruits (apple and pear) are reported as using a high rate of pounds of AI pesticide per acre compared to other crops simply because most crops do not use the same amount of oil. It is misleading in many ways to treat oil in this manner since few people consider oil a dangerous pesticide, especially the way it is used in pear production. Thus, for the rest of this discussion the percent AI per year of a product will be based on a total AI of insecticides and miticides excluding oil from the total.
Pear psylla and codling moth are the key pests on pear. Insecticides, other than oil, applied for control of pear psylla in 1990 were abamectin (Agri-Mek), amitraz (Mitac), cyfluthrin (Baythroid), endosulfan (Thiodan), and oxythioquinox (Morestan). In 1990 these five products accounted for 38.6% (70,000 pounds) of the total non-oil AI insecticide applied to pear. In 2000 the same products accounted for only 14% (25,000 pounds) of non-oil AI insecticide applied to pear. The use of amitraz (Mitac) was limited because of export restrictions. Oxythioquinox (Morestan) use decreased because its registration was voluntarily cancelled by the registrant. Another factor in the reduced use of these five chemicals was the introduction and acceptance of new insecticides for pear psylla control, most notably kaolin (Surround). The high per-acre use rate (50 pounds AI) of kaolin resulted in it constituting 53% of the total non-oil AI applied to pear even though it was only used on about 17% of the acres. It is interesting that the total non-oil insecticide pounds of AI increased from 182,000 pounds in 1990 to 1,006,000 in 2000. The main reason for this increase was the use of organic pesticides such as sulfur (203,000 pounds, 20% of total), calcium polysulfide (75,000 pounds, 7% of total) as well as kaolin. Along with soap, these products accounted for 85% of the total pounds AI of non-oil insecticides used on pear in 2000.
In 1990 and 2000, azinphos-methyl (Guthion) and phosmet (Imidan), used primarily for codling moth control, accounted for 40,100 and 59,700 pounds non-oil AI insecticide applied to pear, respectively. However, in 1990 the use of these two products accounted for 22% of the non-oil AI insecticide applied to pear, while in 2000 they only accounted for 3%. The total amount of chlorpyrifos (Lorsban) used on pear increased from 3,400 pounds AI in 1990 to 19,700 pounds AI in 2000. This use no doubt reflected the loss of parathion (Parathion) and also an increased concern about leafrollers in pear production.
TABLE 7 |
||||||||
| Comparative
summary of insecticide and miticide use in pear reporting blocks
during 1990 and 2000.
|
||||||||
Product/Ingredient
|
Mean
# of Applications/Acre
|
Mean
Rate
lb
AI/Acre
|
%
Acreage
Treated
|
Total
lb AI/Year
(x1000)
|
||||
| 1990 |
2000 |
1990 |
2000 |
1990 |
2000 |
1990 |
2000 |
|
Agri-Mek
(abamectin) |
1.52 |
1.51 |
0.02 |
0.02 |
92.60% |
79.70% |
0.69 |
0.66 |
Mitac
(amitraz) |
1.16 |
1 |
1.38 |
1.5 |
27.40% |
0.83% |
10.3 |
0.3 |
Neem
(azadirachtin) |
NA1 |
3.63 |
NA |
0.02 |
NA |
8.50% |
NA |
0.15 |
Guthion
(azinphos-methyl) |
2.05 |
2.06 |
0.9 |
0.99 |
73.20% |
60.00% |
31.3 |
29.9 |
|
Bacillus
thuringiensis2 |
NA3 |
2.18 |
NA |
0.19 |
NA |
12.40% |
NA |
1.2 |
Lime
sulfur (calcium polysulfide) |
NA |
1.17 |
NA |
18.27 |
NA |
14.50% |
NA |
75.2 |
Sevin
(carbaryl) |
1 |
NR4 |
1.63 |
NR |
2.40% |
NR |
0.92 |
NR |
Lorsban
(chlorpyrifos) |
1.05 |
1.05 |
1.88 |
1.91 |
7.30% |
40.40% |
3.4 |
19.7 |
Apollo
(chlorfentazine) |
NA |
1 |
- |
0.25 |
- |
0.60% |
- |
0.04 |
|
Baythroid
(cyfluthrin) |
1.23 |
- |
0.05 |
- |
79.70% |
- |
1.22 |
- |
Diatomaceous
earth |
2.29 |
1 |
21.69 |
36 |
3.20% |
3.60% |
37.6 |
31.9 |
Diazinon
(diazinon) |
1.44 |
1.22 |
2.15 |
1.97 |
2.30% |
6.90% |
1.7 |
4.1 |
Kelthane
(dicofol) |
NA |
1 |
NA |
3 |
NA |
0.20% |
NA |
0.11 |
Dimethoate
(dimethoate) |
1 |
NA |
1.25 |
NA |
1.30% |
NA |
0.38 |
NA |
|
Thiodan
(endosulfan) |
1.18 |
1.06 |
2.03 |
1.98 |
70.20% |
45.50% |
39.6 |
23.4 |
Asana
(esfenvalerate) |
1.1 |
1.06 |
0.08 |
0.08 |
9.00% |
33.70% |
0.19 |
0.71 |
Plictran
(fenbutatin-oxide) |
1.61 |
1 |
0.8 |
1 |
4.40% |
1.80% |
1.3 |
0.44 |
Pydrin
(fenvalerate) |
1.05 |
1 |
0.33 |
0.3 |
7.20% |
1.10% |
0.58 |
0.08 |
Carzol
(formetanate hydrochloride) |
NA |
1 |
NA |
0.41 |
NA |
5.80% |
NA |
0.58 |
|
Garlic |
NA |
1 |
NA |
0.04 |
NA |
3.00% |
NA |
0.03 |
Savey
(hexathiazox) |
NA |
1 |
NA |
0.17 |
NA |
2.60% |
NA |
0.1 |
Provado
(imidacloprid) |
NA |
1.69 |
NA |
0.26 |
NA |
34.60% |
NA |
2.3 |
Surround
(kaolin) |
NA |
2.13 |
NA |
61.5 |
NA |
16.80% |
NA |
534.4 |
Dithane
(mancozeb) |
1 |
1 |
6.4 |
6 |
0.52% |
0.83% |
0.78 |
1.2 |
|
Supracide
(methidathion) |
1 |
1 |
0.9 |
2 |
2.30% |
1.30% |
0.49 |
0.55 |
Vydate
(oxamyl) |
1 |
NA |
0.42 |
NA |
1.90% |
NA |
0.19 |
NA |
Morestan
(oxythioquinox) |
1.01 |
1 |
1.13 |
0.96 |
67.50% |
4.80% |
18.2 |
1.12 |
Parathion
(parathion) |
1.61 |
NA |
1.2 |
NA |
48.20% |
NA |
23 |
NA |
Pounce,
Ambush (permethrin) |
1.08 |
1 |
0.28 |
0.34 |
2.70% |
0.90% |
0.19 |
0.08 |
|
Oil
(mineral oil) |
2.91 |
3.97 |
19.02 |
19.57 |
99.80% |
95.90% |
1,303.40 |
1,817.00 |
Imidan
(phosmet) |
1.91 |
1.43 |
2.34 |
3.66 |
8.30% |
23.30% |
8.8 |
29.8 |
Phosphamidon
(phosphamidon) |
1 |
NA |
1 |
NA |
0.21% |
NA |
0.05 |
NA |
Piperonyl
butoxide |
1 |
1 |
0.76 |
1.69 |
1.90% |
9.70% |
0.34 |
4 |
Pyramite
(pyridaben) |
NA |
1.1 |
NA |
0.35 |
NA |
30.30% |
NA |
2.9 |
|
Esteem
(pyriproxyfen) |
NA |
1.15 |
NA |
0.11 |
NA |
17.20% |
NA |
0.52 |
Rotenone |
3 |
NA |
0.01 |
NA |
1.90% |
NA |
0.001 |
NA |
Soap |
1.77 |
1.6 |
NR |
9.36 |
5.50% |
10.20% |
NR |
37.3 |
Sulfur |
NR |
1.35 |
NR |
12.87 |
NR |
47.90% |
NR |
203.1 |
Confirm
(tebufenozide) |
NA |
1 |
NA |
0.18 |
NA |
2.30% |
NA |
0.1 |
|
Trithion
(trithion) |
2.67 |
NA |
0.5 |
NA |
0.57% |
NA |
0.18 |
NA |
|
1NA = Not available during that crop year. 2Lbs reported are based on average active ingredient in the different Bt products used, including: Condor, Deliver, Dipel, and Javelin. 3NA = Not applied, but was available during that crop year. 4NR = Not reported or only partially reported during that crop year. |
||||||||
While the data categories from the WSU and the NASS surveys are only congruent
in a few areas (average number of applications of a pesticide, percent
area treated, and pounds of AI used), it is instructive to examine these
data points to understand changes over time. Table 8 summarizes data on
the use of selected insecticides and miticides on pear in Washington over
an eleven-year period. Data from 1990 and 2000 are derived from the WSU
surveys and odd years 1991-2001 are NASS data.
Oil (mineral oil) is the basis of early season control of several pests including pear psylla, spider mites, San Jose scale, and, to some extent, aphids. Most growers use oil early in the pre-bloom period, but summer use has increased since 1999. This increased use is associated with summer applications of oil to suppress pear psylla and spider mites, especially in organic production.
Pear psylla is notorious for developing resistance to insecticides. One product that has been a reliable control for this pest over the last decade has been abamectin (Agri-Mek). It has been used an average of 1.5 times on up to 90% of the pear acreage. The slight decline in area treated in 2001 may be due to the addition of new insecticides like pyriproxyfen (Esteem) and kaolin (Surround) that have helped reduce overwintering pear psylla populations, thereby reducing the need for summer sprays of abamectin (Agri-Mek) as well as alternatives that are useful in the summer such as pyridaben (Pyramite). It is interesting that use of kaolin (Surround) is a regional phenomenon with most use being in the Wenatchee River valley and very little use in the Yakima area. For many years pear psylla was controlled by synthetic pyrethroids but it developed resistance to this class of insecticide. Some esfenvalerate (Asana) is still used, but only in areas where resistance has not fully expressed itself in the pear psylla population. Endosulfan (Thiodan) is another insecticide to which pear psylla has developed resistance in many regions of Washington. The introduction of imidacloprid (Provado) as a control for pear psylla and grape mealybug was only the first in the class of chloronicotinyl insecticides being introduced in pear for pest control. Thiamethoxam (Actara) is another insecticide in this class; the first year it was registered, it had significant use, 1.2 applications on 26% of the pear acreage.
The use of azinphos-methyl (Guthion) has remained fairly constant over time though the area treated has declined somewhat, especially in 2001. This may reflect increased use of mating disruption in pear that can allow growers to reduce input of organophosphate insecticides. The use of chlorpyrifos (Lorsban) increased rapidly in the mid-1990s, partly due to the loss of parathion (Parathion) and partly because of increased concerns about leafrollers. Chlorpyrifos is usually accompanied by oil for control of leafrollers and scale.
TABLE 8 |
||||||||||||||||
| Comparative
summary of insecticide and miticide use on pear in Washington from
1990 through the 2001 data. Data includes average number of applications
per acre and the percentage of the total area that was treated. |
||||||||||||||||
| Insecticides | 1990
|
1991
|
1993
|
1995
|
1997
|
1999
|
2000
|
2001
|
||||||||
| Avg
# Apps Per Acre |
%
Area Treated |
Avg
# Apps Per Acre |
%
Area Treated |
Avg
# Apps Per Acre |
%
Area Treated |
Avg
# Apps Per Acre |
%
Area Treated |
Avg
# Apps Per Acre |
%
Area Treated |
Avg
# Apps Per Acre |
%
Area Treated |
Avg
# Apps Per Acre |
%
Area Treated |
Avg
# Apps Per Acre |
%
Area Treated |
|
| Agri-Mek (abamectin) | 1.5 |
93 |
1.5 |
94 |
1.7 |
95 |
1.3 |
77 |
1.5 |
80 |
1.4 |
79 |
1.5 |
80 |
1.5 |
68 |
| Mitac (amitraz) | 1.2 |
28 |
1.1 |
18 |
1 |
4 |
nr1 |
- |
nr |
1 |
6 |
1 |
<1 |
nr |
||
| Guthion (azinphos-methyl) |
2.1 |
73 |
1.9 |
70 |
2.5 |
89 |
2.5 |
78 |
2.3 |
87 |
1.9 |
68 |
2.1 |
60 |
2 |
46 |
| Bacillus thuringiensis2 | nr1 |
3 |
+3 |
+ |
1.7 |
3 |
2.1 |
9 |
2.2 |
12 |
1.3 |
6 |
||||
| Lorsban (chlorpyrifos) | 1.1 |
7 |
1.2 |
12 |
1.1 |
28 |
1 |
37 |
1.1 |
57 |
1.1 |
59 |
1.1 |
40 |
1 |
33 |
| Baythroid (cyfluthrin) |
1.2 |
80 |
1.2 |
71 |
1.2 |
58 |
+ |
+ |
nr |
nr |
nr |
|||||
| Thiodan (endosulfan) |
1.2 |
70 |
1.1 |
70 |
1.2 |
71 |
1.2 |
36 |
1.3 |
49 |
1.1 |
65 |
1.1 |
45 |
1.1 |
45 |
| Asana (esfenvalerate) |
1.1 |
9 |
1.2 |
9 |
1.1 |
6 |
1 |
14 |
1.1 |
18 |
1.3 |
9 |
1.1 |
34 |
1 |
16 |
| Carzol (formetanate hydrochloride) |
nr |
nr |
+ |
nr |
1.4 |
4 |
1 |
11 |
1 |
6 |
1 |
16 |
||||
| Savey (hexythiazox) |
nr |
nr |
nr |
nr |
nr |
1.1 |
12 |
1 |
3 |
nr |
||||||
| Provado (imidacloprid) |
nr |
nr |
nr |
nr |
1.3 |
10 |
1.6 |
30 |
1.7 |
3 |
1.3 |
23 |
||||
| Surround (kaolin) |
nr |
nr |
nr |
nr |
nr |
2.2 |
5 |
2.1 |
17 |
2.5 |
15 |
|||||
| Morestan (oxythioquinox) |
1 |
67 |
1.1 |
53 |
1 |
61 |
1 |
26 |
1 |
10 |
1.1 |
2 |
1 |
5 |
nr |
|
| Oil (mineral oil) |
2.9 |
99 |
2.8 |
94 |
2.8 |
96 |
2.1 |
86 |
2.6 |
95 |
3.6 |
92 |
4 |
96 |
3.8 |
85 |
| Imidan (phosmet) |
1.9 |
8 |
1.4 |
19 |
1.4 |
6 |
1.2 |
19 |
1.8 |
9 |
1.5 |
22 |
1.4 |
23 |
1.4 |
28 |
| Pyramite (pyridaben) |
nr |
nr |
nr |
nr |
nr |
1.1 |
20 |
1.1 |
30 |
1.1 |
15 |
|||||
| Esteem (pyriproxifen) |
nr |
nr |
nr |
nr |
nr |
1 |
24 |
1.2 |
17 |
1.1 |
33 |
|||||
| Actara (thiamethoxam) |
nr |
nr |
nr |
nr |
nr |
nr |
nr |
1.2 |
26 |
|||||||
| 1nr
= Reflects values not recorded because the chemical was either not
available, or not used. 2Lbs reported are based on average active ingredient in the different Bt products used, including: Condor, Deliver, Dipel, and Javelin. 3+ = NASS did not report due to insufficient data. |
||||||||||||||||
Fungicide Use
A table comparing fungicide usage during 1990 and 2000 can be found at the WSU Pest Management Practices Survey 2000 Results Website (http://opus.tfrec.wsu.edu/~wjones/Survey2000/ ). Several compounds were taken off the market including oxythioquinox (Morestan). (It should be noted that oxythioquinox has acaracide, insecticide and fungicide activities.) However, these compounds were replaced by products such as kresoxim-methyl (Sovran), oxytetracycline (Mycoshield), propiconazole (Orbit), thiram (Thiram), trifloxystrobin (Flint), and triflumizole (Procure). Although dodine (Syllit), and dinocap (Karathane) were available, there were no reported uses in the 2000 survey.
In addition to the loss of some chemicals and gain of others, the most noticeable changes in fungicide usage were the increased use of calcium polysulfide (lime sulfur) and sulfur during the 2000 crop season. However, there were slight reductions in the use of copper, triadimefon (Bayleton) and ziram (Ziram). The difference in sulfur and lime sulfur usage may actually be due to the way sulfur use was reported by respondents each year. For the 2000 survey, growers may have only listed “sulfur,” rather than specifying lime sulfur (calcium polysulfide), or their reporting may have included copper sulfate. The same possibility also exists for copper. Respondents may have lumped different types of copper compounds together and referred to all of them as “copper.”
Plant Growth Regulator and Nutrient Use
A table comparison of Plant Growth Regulator (PGR) and Nutrient spray usage reported in 1990 and 2000 is also available on the Website cited in the previous section. The primary use of PGRs in pear is for blossom/fruit thinning. In 1990, the only reported PGRs used were NAA and NAD. However, in 2000, growers also reported using a gibberellin (GA14), carbaryl, and ethephon. Nutrients were difficult to report because most respondents wrote in a product name without indicating the purpose of its use, or they described a use but did not provide a product name. Since many products are multi-nutrient formulations, the actual intended use cannot be extrapolated. Also, many respondents reported using a leaf-feed without indicating the product or specific deficiency targeted. The values shown in our table on the Website are restricted to those nutrients that were fully and clearly disclosed. It is important to note that these values for nutrient use cannot be compared to NASS values. NASS only reports phosphorus, potash and nitrogen (generally from manure) applied as soil amendments. Their surveys do not report other forms of applied nutrients. The nitrogen values reported in the Web report (http://opus.tfrec.wsu.edu/~wjones/Survey2000/) reflect non-manure or soil amendment nitrogen. This means that the values for total nitrogen applied are underestimated.
Cherry Pesticide Use and IPM Practices
Out of nearly 500 cherry surveys mailed, 110 (22%) were returned. Of those, only 74 were valid (complete and usable) surveys. The valid surveys represented 1,027 acres of cherry production or 5.7% of Washington’s total bearing cherry acreage (WASS 2001). The survey respondents’ average acreage in cherry production was about 23 acres. The most common variety produced was Bing, followed by Lambert, Lapin, Rainier, and Van.
Characterization of Farming Operations
The vast majority of survey respondents were full-time growers (82.5%). Nearly all (98%) classified their pest management practices as “conventional,” meaning they used standard chemical control practices (Table 9). Less than 2% of the growers employed any organic practices in their standard operations. Since this is the first comprehensive survey of cherry pesticide use or IPM practices in Washington there is no past reference with which to compare these results. A recent report by Granatstein and Kirby (2002) generally agrees with this proportion of organic cherry production.
TABLE 9 |
||
| Comparison
of the proportion of growers that were full- versus part-time and
using different farming practices along with the average size of
their cherry orchards during 2000. |
||
| Farming Practice | %
Growers |
Mean
Acres |
| Full-time | 82.5 |
18.8 |
| Part-time | 17.5 |
7.2 |
| Conventional | 98.1 |
15.5 |
| Mixed1 | 1.2 |
6 |
| Transitional | 0.6 |
6.3 |
| Organic | 0.1 |
1 |
|
1Mixed
means that the grower reported having some acres in conventional
and some in organic production. |
||
Pest Management Advice
As with pear and apple growers,
cherry growers have several different sources of information available
to help them make pest management decisions. The grower responses to the
question regarding the importance of different information sources in
making pest management decisions are summarized in Table 10. Most growers
rated agricultural chemical and packinghouse fieldmen as being “very”
or “somewhat” important sources of information in helping
them arrive at pest management decisions. Private consultants were also
very important to many growers. The value of Washington State University
as a source for advice is reflected in the percent of growers that rated
Cooperative Extension and the Crop Protection Guide as being very important
in helping them arrive at pest management decisions.
TABLE 10 |
|||
|
Percentage
of survey respondents who rated the value of information from different
sources in helping them arrive at pest management decisions. |
|||
|
Information
Source |
Very
Important |
Somewhat
Important |
Not
Important |
Private
Consultant (PC) |
47 |
20 |
33 |
Agricultural
Chemical Industry Fieldman (ACF) |
49 |
35 |
15 |
Cooperative
Extension (CE) |
32 |
42 |
26 |
Packinghouse
Fieldmen (PF) |
48 |
40 |
12 |
Other
Growers (OG) |
8 |
73 |
19 |
WSU
Crop Protection Guide (CPG)1 |
46 |
39 |
15 |
Orchard
Pest Management (OPM)2 |
18 |
29 |
53 |
| 1Crop
Protection Guide for Tree Fruits in Washington is a publication of
Washington State University Cooperative Extension. The latest edition
can be found on-line at http://cru.cahe.wsu.edu/CEPublications/eb0419/eb0419.pdf 2Orchard Pest Management: A Resource Book for the Pacific Northwest is published by The Good Fruit Grower, Yakima, Washington. |
|||
Pest Management Activities
Whether conducted by the grower,
fieldman, or private consultant, orchard monitoring was by far the most
frequent pest management activity employed; about 90% of the respondents
indicated its use, either often or sometimes (Table 11). The use of economic
thresholds and reduced chemical rates ranked next, with each employed
by nearly 75% of the growers often or sometimes. Pheromone trapping was
also a common practice used by cherry growers. The least-used activity
was alternate row spraying; nearly 65% growers reported that they seldom
or never used this practice. This is likely because it is very important
for pesticides that are applied to cherry to have excellent coverage of
fruit and foliage.
TABLE 11 |
||||
|
Percentage
of cherry growers who reported using non-conventional pest management
practices. |
||||
| Management Practice | Often |
Sometimes |
Seldom |
Never |
| Field Monitoring | 78 |
12 |
4 |
6 |
| Alternate Row Spraying | 9 |
26 |
26 |
39 |
| Economic Threshold | 35 |
39 |
8 |
18 |
| Biological Control | 24 |
26 |
21 |
29 |
| Reduced Chemical Rates | 20 |
54 |
19 |
8 |
| Pheromone Traps | 40 |
19 |
9 |
32 |
Pesticide Use Trends
To get a relative sense of how the growers perceive their overall pesticide usage over the past five years, we asked respondents to indicate how their pesticide use may have changed from 1996 through 2000. The majority (70%) indicated that there was no change in the amount of pesticides used, 23% decreased usage, and only 7% said their use increased. This result reflects the stability of pesticide programs on cherry, much of which is dictated by a zero tolerance for infestation by certain pests (e.g., cherry fruit fly).
Target of Pesticide Application
Survey respondents were asked to name the target pest of each chemical treatment (Table 12). The most commonly cited insect pest was Western cherry fruit fly, with 97% of the growers reporting it as a target and the frequency of treatment averaging 4.4 times during the season. This result was expected, as the cherry fruit fly is the key insect pest of cherry production in Washington. California has a zero-tolerance quarantine against cherry fruit fly larvae and penalties are so severe that growers take every precaution to keep their fruit protected against infestation by this pest. Cherry fruit fly is controlled completely by insecticide applications. Other commonly cited pests were black cherry aphids, spider mites, and leafrollers.
The most common disease target
of pesticide applications was powdery mildew, with 87% of the growers
citing this problem and the problem being cited an average of 4.7 times
during the season. Bacterial gummosis (Pseudomonas), Coryneum
blight, and brown rot were also frequent targets of pesticide applications
cited by the respondents.
TABLE 12 |
||
|
Number
of times growers cited a pest as being the target of a pesticide
application and the percent of acres treated at least once. |
||
|
Target
Pest |
Average
# Times Grower Cited Pest as Target |
%
Acreage Represented |
| Insect/Mite | ||
| Black Cherry Aphid | 1.9 |
57.10% |
| Cherry Fruit Fly | 4.4 |
94.30% |
| Cherry Rust Mite | 1.4 |
15.70% |
| Cutworms | 1.1 |
12.90% |
| Green Soldier Bug | 1.7 |
4.30% |
| Leafhopper | 1.2 |
7.10% |
| Leafminer | 1.5 |
2.90% |
| Leafroller | 1.8 |
20.00% |
| Lecanium Scale | 1.3 |
4.30% |
| Mealybug | 1 |
1.40% |
| San Jose Scale | 1 |
5.70% |
| Shothole Borer | 1.8 |
12.90% |
| Spider Mite | 1.1 |
24.30% |
| Stink Bug | 2 |
1.40% |
| Thrips | 1 |
1.40% |
| Unknown | 2.5 |
27.10% |
| Disease | ||
| Brown Rot | 2.6 |
18.60% |
| Coryneum Blight | 1.7 |
30.00% |
| Cytophera | 2 |
1.40% |
| Powdery Mildew | 4.7 |
87.10% |
| Bacterial gummosis (Pseudomonas) | 1.2 |
30.00% |
| Unknown | 2.17 |
17.10% |
Timing of Pesticide Applications
Table 13 summarizes the data
on last spray dates for each class of pesticide used in cherry orchards,
giving both average and range. The beginning of harvest for cherry varies
considerably from one growing region to another, from one year to another,
and between varieties. It can begin mid-June or earlier in some areas
and as late as mid-July in others. Harvest of some varieties and in some
later areas may last through mid-August. The last spray date on cherry
may be somewhat confusing as in some cases it seems to occur after the
cherry harvest has started. Indeed this is the case for some pesticide
applications; certain applications occur just prior to harvest or even
after the harvest has been completed. An example of this latter case is
dimethoate (Dimethoate) application for control of cherry fruit fly (explanation
follows in the Insecticide/Miticide section). Similarly, while most of
the fungicides are applied early in the season, some are applied close
to or even after harvest to manage powdery mildew.
TABLE 13 |
||
|
Average
date of last application of a pesticide class during 2000. |
||
|
Pesticide
Class |
Average
Date of Last Spray |
Range |
| Insecticide | 11
July |
23
June to 23 July |
| Fungicide | 16
July |
13
June to 25 July |
| Nutrients | 9
July |
11
May to 21 June |
| PGR | 2
June |
27
May to 11 June |
| Herbicide | 19
July |
13
June to 1 Sept |
Chemical Application Methods
We asked survey respondents to indicate how they applied their pesticides, percentage of the block acreage treated, and what volumes were used. Ninety-six percent of the time the entire orchard is treated when applying a pesticide. Most of the pesticide applications are made by ground using an airblast sprayer (88%), though 10% are applied by air, primarily cherry fruit fly sprays close to harvest. Only about 15% of growers use water volumes less than 100 gallons per acre to apply pesticides and these are most likely those associated with aerial applications.
Insecticides/Miticides
The results for insecticide and miticide usage are shown in Table 14. As in pear production, oil constitutes the highest total AI applied to cherry as an insecticide and the second highest, just after sulfur, as a fungicide. Oil (mineral oil) comprised about 73% of the total insecticide AI and 28% of the total fungicide AI on cherry. Sulfur and oil have become important components of a powdery mildew program on cherry so it is not surprising that these products make up such a large proportion of AI especially considering the amounts applied per application. The five insecticides with the most use on cherry are targeted at control of the key pest, the cherry fruit fly. These are azinphos-methyl (Guthion), carbaryl (Sevin), malathion (Malathion), spinosad (Success), and dimethoate (Dimethoate), together comprising 62.2% of total non-oil AI applied per year. The most used insecticide (not considering oil) was azinphos-methyl (Guthion), being applied an average of 1.8 times per acre and being applied to over 90% of all acres. This product is typically used as the first one or two insecticides for cherry fruit fly control then growers switch to carbaryl (Sevin), malathion (Malathion), or spinosad (Success) as harvest approaches. The use of dimethoate (Dimethoate) occurs primarily in the post-harvest period as a clean-up treatment to prevent cherry fruit fly infestations in fruit remaining in the tree after harvest. Chlorpyrifos (Lorsban) and oil are used on a majority of cherry acres, almost exclusively as a pre-bloom application for control of scale, European red mite, leafroller, and aphids.
TABLE 14 |
||||
|
Insecticide and miticide usage in cherry orchards for the 2000 crop
season. |
||||
| Product/Ingredient | Mean
# of Applications/Acre |
Mean
Rate (lb AI/acre/appl.) |
%
Acreage Treated |
Total
lb AI/year (x1000) |
| Insecticide/Miticide | ||||
| Guthion | 1.8 |
0.9 |
91.90% |
34.3 |
| Bacillus thuringiensis1 | 1 |
0.2 |
4.50% |
0.2 |
| Sevin | 1.8 |
1.9 |
72.00% |
59.1 |
| Lorsban | 1 |
2 |
66.30% |
32.8 |
| Apollo | 1 |
0.03 |
1.90% |
0.01 |
| Diazinon | 1.6 |
2.3 |
13.20% |
11.8 |
| Dimethoate | 1.1 |
1 |
28.40% |
7.8 |
| Thiodan | 1.4 |
2.1 |
21.40% |
15 |
| Asana | 1 |
0.1 |
2.64% |
0 |
| Vendex | 1 |
1 |
0.94% |
0.2 |
| Fish oil | 1 |
8 |
0.57% |
1.1 |
| Provado | 1 |
0.1 |
0.28% |
0.001 |
| Malathion | 2.2 |
1.5 |
56.90% |
44.8 |
| Vydate | 1 |
1 |
0.75% |
0.2 |
| Oil (mineral oil) | 1.2 |
33.8 |
65.20% |
644.6 |
| Omite | 1 |
1.9 |
0.38% |
0.2 |
| Pyrenone | 3.8 |
0.2 |
2.60% |
0.5 |
| Soap | 1 |
12 |
0.57% |
1.7 |
| Success | 1.6 |
0.1 |
21.90% |
0.8 |
| Sulfur | 1.3 |
7.2 |
11.20% |
25.6 |
| Fungicide | ||||
| Abound | 1 |
0.3 |
2.40% |
0.1 |
| Benlate | 1 |
0.8 |
10.80% |
2.2 |
| Lime sulfur | 1.33 |
10.1 |
13.60% |
44.6 |
| Captan | 1 |
2.2 |
1.40% |
0.8 |
| Bravo | 1 |
1 |
0.19% |
0 |
| Copper hydroxide | 1.2 |
5.1 |
65.30% |
97.1 |
| Rubigan | 1.46 |
0.1 |
37.50% |
0.9 |
| Ridomil | 2 |
0.3 |
1.70% |
0.2 |
| Rally | 1.78 |
0.1 |
70.20% |
4 |
| Oil | 1.77 |
15.6 |
29.40% |
197.6 |
| Orbit | 1.84 |
0.1 |
73.40% |
3.5 |
| Sulfur | 2.63 |
7.3 |
74.50% |
350.9 |
| Elite | 1.55 |
0.2 |
31.90% |
2.3 |
| Lbs reported are based on average active ingredient in the different Bt products used, including Condor, Deliver, Dipel, and Javelin. | ||||
The NASS surveys included pesticide use on sweet cherries for odd years
from 1991 through 2001. These data along with the Washington 2000 survey
provide a long-term picture of use over the last decade. Table 15 gives
the average number of applications per acre and percent area treated of
selected insecticides in each year. Azinphos-methyl (Guthion) use increased
after 1991 and has remained at between one and two applications per year
to about 90% of the sweet cherry acres until 2001 when a decline in the
percent area treated was noted. This could be due to the increased use
of spinosad (Success) in that year. Carbaryl also had a high use rate
and showed an increase in the average number of applications per acre
and percent area treated over time. The main reason for the increased
use of azinphos-methyl (Guthion) and carbaryl (Sevin) was reduced use
of parathion (Parathion) and methyl-parathion (Penncap-M). Regulatory
action eliminated the use of these products on sweet cherry so alternative
products were needed. Endosulfan (Thiodan) and diazinon (Diazinon) were
used to control the black cherry aphid and use was fairly uniform over
the last decade but the combination of these products usually accounts
for less than 50% of the treated acres. Oil (mineral oil) and chlorpyrifos
(Lorsban) are typically used as a tank mix in the pre-bloom period to
control leafroller, aphids, and scale and to suppress spider mites. The
increased use of chlorpyrifos (Lorsban) from 1991 to 1993 is directly
related to the loss of parathion (Parathion). The use of spinosad (Success)
occurred as soon as it was registered. It is an excellent leafroller control
product but is also used to control cherry fruit fly.
TABLE 15 |
||||||||||||||
|
Comparative
summary of insecticide and miticide use on cherry in Washington
from 1991 through 2001. Data includes average number of applications
per acre and the percentage of the total area that was treated. |
||||||||||||||
| Insecticides | 1991 |
1993 |
1995 |
1997 |
1999 |
2000 |
2001 |
|||||||
Avg
# Apps Per Acre |
%
Area Treated |
Avg
# Apps Per Acre |
%
Area Treated |
Avg
# Apps Per Acre |
%
Area Treated |
Avg
# Apps Per Acre |
%
Area Treated |
Avg
# Apps Per Acre |
%
Area Treated |
Avg
# Apps Per Acre |
%
Area Treated |
Avg
# Apps Per Acre |
%
Area Treated |
|
| Guthion (azinphos-methyl) | 1.5 |
39 |
1.5 |
91 |
1.9 |
94 |
1.7 |
84 |
1.5 |
86 |
1.8 |
92 |
1.6 |
72 |
| Sevin (carbaryl) | 1.2 |
10 |
1.2 |
33 |
1.4 |
57 |
1.5 |
50 |
1.5 |
63 |
1.8 |
72 |
1.7 |
70 |
| Lorsban (chlorpyrifos) | 1 |
15 |
1 |
74 |
1 |
49 |
1.1 |
59 |
1.1 |
59 |
1 |
2 |
1 |
48 |
| Diazinon (diazinon) | 1.6 |
5 |
1.6 |
26 |
1 |
5 |
1.1 |
6 |
2 |
1.6 |
13 |
1 |
8 |
|
| Dimethoate (dimethoate) | 1.6 |
3 |
1 |
6 |
1.1 |
10 |
1 |
9 |
1 |
15 |
1.1 |
28 |
1 |
17 |
| Malathion (malathion) | 2.1 |
65 |
1.9 |
52 |
1.8 |
51 |
2.4 |
57 |
1.2 |
65 |
1.9 |
40 |
||
| Oil (mineral oil) | 1 |
56 |
1 |
76 |
1 |
54 |
1 |
59 |
1.2 |
63 |
1.2 |
65 |
1.4 |
68 |
| Parathion (parathion) | 2.7 |
74 |
nr1 |
nr |
nr |
nr |
nr |
nr |
||||||
| Provado (imidacloprid) | nr |
nr |
nr |
nr |
nr |
1 |
<1 |
+2 |
||||||
| Penncap-M (methyl parathion) | 1.2 |
4 |
1.1 |
5 |
1.1 |
5 |
+ |
+ |
nr |
nr |
||||
| Thiodan (endosulfan) | 1.1 |
5 |
1.1 |
15 |
1.2 |
12 |
1.3 |
13 |
1.1 |
10 |
1.4 |
21 |
1.2 |
12 |
| Success (spinosad) | nr |
nr |
nr |
nr |
nr |
1.6 |
22 |
1.2 |
36 |
|||||
| 1
nr = Reflects values not recorded because the chemical was either
not available, or not used. 2 + = NASS did not report due to insufficient data. |
||||||||||||||
Fungicides
The top four compounds used to treat disease in cherries, in terms of total pounds applied, were sulfur, copper hydroxide, calcium polysulfide (lime sulfur), and oil. In terms of percent treated acreage, propiconazole (Orbit) and mycobutanil (Rally) were applied to 73% and 70% of cherry acreage, respectively.
PGRs and Other Horticultural Chemicals
Plant Growth Regulators (PGRs) are used in sweet cherry primarily to extend the harvest period. Normally, GA3 (ProGibb) is applied three weeks prior to expected harvest in order to delay maturity 5 to 7 days. Nutrients were difficult to report because most respondents wrote in a product name without indicating the purpose of its use, or only the use without a product name. Since many products are formulated with multiple nutrients, the actual intended use cannot be extrapolated. For a complete listing of the nutrient sprays applied see the Website mentioned earlier in this article.
Herbicides
Herbicides are generally used early in the season and again after harvest to control over-wintering weeds. The most commonly used herbicide was glyphosate (Roundup), which was applied an average of 1.8 times and was applied to 66.5% of cherry acreage. Other herbicides applied an average of one time on 20 to 30% of cherry acreage were paraquat (Gramoxone), oryzalin (Surflan) and oxyfluorfen (Goal).
Conclusions
This article focused primarily on the use of insecticides and miticides in pear and cherry production in Washington. Of all the pesticide types, insecticides have come under the greatest regulatory pressure since the passage of FQPA in 1996. The most important insect pests in pear are pear psylla and codling moth; in cherry, it is the cherry fruit fly. Control of these pests is the cornerstone of pest management in these tree fruits.
Pear IPM programs have historically
been driven by pear psylla’s resistance to pesticides. An example
is the reduction in use of cyfluthrin (Baythroid), a once-effective tool
to which the pear psylla developed resistance. Since 2000, many new insecticides
have been introduced into the pear production system. Some of these are
“softer” alternatives to azinphos-methyl (Guthion) and phosmet
(Imidan). Like mating disruption, use of softer, narrower-spectrum insecticides
can help conserve natural enemies of pear psylla. However, resistance
management strategies will need to be carefully followed if new products
are to last longer than their predecessors. This is especially true for
the chloronicotinyl class.
The opportunity to modify the IPM system in cherry is going to prove more
difficult than in apple or pear. The cherry fruit fly is a direct pest
for which there is zero tolerance. The hope is that some of the new insecticides
just being registered for use on cherry will provide a softer control,
yet one equally effective as the organophosphate and carbamate insecticides.
One example is spinosad (Success) that seems to have less negative impacts
on natural enemies than the organophosphate insecticides.
The next five years will be critical time for the Washington tree fruit industry. Several new insecticides and fungicides have been registered in the last few years and their use is just beginning to show up on surveys as growers become familiar with their pest control potential and researchers understand how to integrate them into IPM programs. It is important to have a good baseline of information now to gauge the success or failure of establishing various IPM systems. The information presented in this report provides a baseline for evaluating future changes in IPM programs and points out the need to continue surveying and analyzing pesticide use patterns.
Jay Brunner, Wendy Jones, Elizabeth Beers, Jerry Tangren, John Dunley, and Chang-lin Xiao are with the Washington State University Tree Fruit Research and Extension Center in Wenatchee, (509) 663-8181. Gary Grove is with the Irrigated Agriculture Research and Extension Center in Prosser. Jay Brunner can be reached at jfb@wsu.edu.
REFERENCES
Asquith, D. and L. A. Hull. 1979. Integrated pest management systems in Pennsylvania apple orchards. Pest Management Programs for Deciduous Tree Fruits and Nuts. [eds.] D. J. Boethel and R. D. Eikenbary. pp 203-222. Plenum Press, New York.
Beers, E. H. and J. F. Brunner. 1991. Washington state apple and pear pesticide use survey, 1989-1990. Report to USDA-NAPIAP.
Beers, E. H., J. F. Brunner, M. Willett and G. Warner. 1993. Orchard Pest Management: A Resource Book for the Pacific Northwest. The Good Fruit Grower, Yakima, Washington.
Brunner, J. F., W. Jones, E. H. Beers, G. V. Tangren, J. Dunley, C. Xiao, G. G. Grove. 2003. A decade of pesticide use and IPM practices in Washington apple orchards. Agrichemical and Environmental News (May) 205. http://aenews.wsu.edu/May03AENews/May03AENews.htm#AppleSurvey.
Brunner, J. F., S. Welter, C. Calkins, R. Hilton, E. Beers, J. Dunley, T. Unruh, A. Knight, R. Van Steenwyk, P. Van Buskirk. 2001. Mating disruption of codling moth: a perspective from the Western United States. IOBC wprs Bull. Vol. 25(1): 207-215.
Calkins, C. O. 1998. Review of the codling moth areawide suppression program in the western United States. J. Agric. Entomol. 15(4): 327-333.
Granatstein, D. and E. Kirby. 2002. Washington Organic Crop Acreage, http://organic.tfrec.wsu.edu/OrganicIFP/Home/WAOrgTreeFruit02.PDF. In: Organic and Integrated Fruit Production Home Page, http://organic.tfrec.wsu.edu/OrganicIFP/Home/Index.html.
NASS. 2002. Agricultural Chemical Usage 2001 Fruit and Nut Summary. July 2002. USDA/NASS/ERS.
NASS. 2000. Agricultural Chemical Usage 1999 Fruit and Nut Summary. July 2000. USDA/NASS/ERS.
NASS. 1998. Agricultural Chemical Usage 1997 Fruit and Nut Summary. July 1998. USDA/NASS/ERS.
NASS. 1996. Agricultural Chemical Usage 1995 Fruit and Nut Summary. July 1996. USDA/NASS/ERS.
NASS. 1994. Agricultural Chemical Usage 1993 Fruit and Nut Summary. July 1994. USDA/NASS/ERS.
NASS. 1992. Agricultural Chemical Usage 1991 Fruit and Nut Summary. July 1992. USDA/NASS/ERS.
Smith, T. J., J. E. Dunley, E. H. Beers-Peryea, J. F. Brunner, G. G. Grove, K. M. Williams, F. J. Peryea, R. Parker, D. F. Mayer, C. Daniels, T. Maxwell, and S. Roberts. 2000. 2000 Crop Protection Guide for Tree Fruits in Washington. Washington State University Coop. Extension EB 0419.
WASS. 2001. Washington Agricultural Statistics 2000-2001. Wash. Agric. Statistics Service, USDA/WSDA, Olympia, WA.
WASS. 1996. Washington Agricultural Statistics 1995-1996. Wash. Agric. Statistics Service. USDA/WSDA, Olympia, WA.
Go to this issue's Table of Contents
Go to Agrichemical and Environmental News Index
Go to WSPRS (Washington State Pest Management Resource Service) Home Page
Items in this section often appear in the words of the sponsoring organization or original news release. AENews editorial staff is not responsible for the accuracy of the content.
First Human WNV Case in Washington Likely
Yesterday, Washington State Department of Health (DOH) announced a Yakima area man as the first probable human case of West Nile virus (WNVV) acquired in Washington State. Previously in May, a suspected human case of WNV in Washington turned out to be Saint Louis Encephalitis upon further diagnostic testing. Saint Louis Encephalitis is in the same family as WNV and has occurred in Washington before. This summer, DOH Public Health Laboratory expanded its diagnostic capabilities and now has a new test that can distinguish between WNV and Saint Louis Encephalitis, so the current diagnosis is fairly certain. However, as with all suspected cases of WNV, confirmation will occur in the federal Centers for Disease Control laboratories in Fort Collins, Colorado.
The 36-year-old Yakima area man is recovering after being hospitalized earlier this month. According to DOH's August 14 West Nile Virus Newsletter, 606 birds submitted by local health departments have been tested this year for WNV. All have been negative for the virus. In addition, 34 horses from 18 counties have been tested and these results were also negative. At least 32 suspected cases of human WNV have been evaluated. Twenty-eight were ruled out as WNV and four cases have tests results that are pending.
Compared to elsewhere in the country, it is atypical that a human case would precede bird or horse cases, which generally are detected about a month before human infection. The virus builds in bird and mosquito populations.
More information about WNV is available on the Washington State University Cooperative Extension Website at
Pesticide Stewardship Conference Slated for October
The 4th Annual National Pesticide Stewardship Alliance (NPSA) Conference is scheduled for October 19 through 22, 2003, in Tucson, Arizona. This year's theme is Stewardship Issues: Discussions for a Global Community. Focus topics will include the future of state pesticide disposal programs, residential pesticide stewardship, and label language pertaining to container disposal.
For more information on the conference and the NPSA organization, visit their Website:
http://www.npsalliance.org
XI International IUPAC Symposium on Mycotoxins and Phycotoxins
Call for Papers
The XI International IUPAC Symposium on Mycotoxins and Phycotoxins will be held in Bethesda, Maryland, from the 17th to the 21st of May, 2004.
The International Union of Pure and Applied Chemistry (IUPAC) Food Chemistry Commission initiated the series of International Symposia on Mycotoxins and Phycotoxins and the first was held in Kungalv, Sweden in 1973. Since then nine symposia have been held in Pulawy, Poland; Paris, France; Lausanne, Switzerland; Vienna, Austria; Pretoria, South Africa; Tokyo, Japan; Mexico City, Mexico; Rome, Italy and Guaruja, Brazil. The symposia have become the principal international interdisciplinary meeting on mycotoxins and phycotoxins. The most recent, held in Brazil (May 2000), focused on the global significance of mycotoxins and phycotoxins, their occurrence, assay proficiency, toxicology and risk assessment. The XI symposium will assess progress or advances made since Brazil 2000 in relation to overall goals of the series and the evolving global perspective of food safety. Internationally renowned guest scientists will highlight: advances in methodology; the value of risk assessment and its regulatory use; laboratory quality assurance and quality control, accreditation and method validation, particularly in developing countries. Advances in genomics for detection and evaluating the impact of mycotoxins and phycotoxins on human and animal health, as well as control strategies will be discussed. In addition, an estimated 200 posters will be presented. There will also be a “self assessment” of the IUPAC Symposia on Mycotoxins and Phycotoxins series from a historical and impact perspective. The symposium is of prime importance to educators and researchers worldwide.The Organizing and Scientific committees invite submission of abstracts for oral or poster presentation on cutting edge research in the topics listed below.
T1 – Novel sampling and analytical techniques
T2 – Advances in ecology and physiology
T3 – Chemistry and toxicology of mycotoxins and phycotoxins
T4 - Occurrence in food and feed of expected and new and emerging toxins
T5 – New technologies for assessing and predicting risk
T6 – Tailoring risk assessment/management to specific subpopulations
T7 – Solutions/preventative intervention: biocontrol, chemical modifications and salvage technologies,
T8 – Trade, regulations and quality assurance
T9 – Emerging issues in risk communication
T10- Mycotoxins in botanicals and traditional remedies
T11- GMOs, nanoscience and nanotechnologies.Abstracts are due by October 6, 2003, and must adhere to the following format.
1. 300 words or less, single-spaced, 12 font size and in English.
2. The title must be in CAPITAL letters.
3. Must contain author(s) name(s) and full address, including telephone and fax numbers and e-mail (where applicable)
4. Abstract must be precise and informative. Should contain a statement of the problem, objectives, methods, summary of results and conclusions, and application. It is not acceptable to say "results will be discussed" or “the paper will address…”
5. The title must be as brief as possible, but sufficient to indicate clearly the nature of the study and category.
6. Electronic (e-mail) submission is preferred (hnjapau@cfsan.fda.gov; strujill@cfsan.fda.gov; dpark@cfsan.fda.gov) but abstracts may also be faxed to 301 436 2644 (attn: IUPAC SYMPOSIUM) or PC floppies (MS word) mailed to the IUPAC XI Symposium on Mycotoxins and Phycotoxins Secretariat (Symposium Secretariat).
Regional Ag Health & Safety Conference
September 7-9, 2003, are the dates of the western regional conference on agricultural health and safety issues. This timely conference will be held at the Holiday Inn Gateway in San Francisco. The theme for this year is "Challenges in Agricultural Health and Safety." This important meeting for agricultural professionals is jointly sponsored by the Western Center for Agricultural Health and Safety at UC Davis and the Pacific Northwest Agricultural Safety and Health Center at the University of Washington, Seattle, along with the Center for Occupational and Environmental Health at UC Berkeley.
The program themes include sessions on injuries and ergonomics, illnesses and diseases (including respiratory diseases and pesticide illnesses), and health and safety challenges faced by farmworkers.
A special feature of this year's conference will be breakfast discussion tables focusing on specific issues. Here is a chance to join in lively and informal discussions on topics of particular interest to you and meet others with similar interests.
More information can be found at http://agcenter.ucdavis.edu/Announce/AgChallenges2003.php.
The Washington Pest Consultants Association (WaPCA) has been involved in recycling plastic pesticide containers since the early 1990s in Washington State. Northwest Ag Plastics, Inc. is contracted to operate the recycling program.
For information on the program and the parameters for disposal, see the WSU Pesticide Education Program's Web page on the subject at
http://pep.wsu.edu/waste/wapca.html
For the 2003 collection schedules, see
http://www.nwagplastics.com/schedules/schedule.html
or see the individual PDF file for the area and time period in which you are interested:
The U.S. Environmental Protection Agency (EPA) has announced the release of a publication on pesticide sales and use for 1998-99, available at Internet URL
http://www.epa.gov/oppbead1/pestsales/
The reports are available as HTML and PDF files. The Web site also has versions of the previous reports from 1996-97 and 1994-95.
Go to this issue's Table of Contents
Go to Agrichemical and Environmental News Index
Go to WSPRS (Washington State Pest Management Resource Service) Home Page